Monthly consumption for an individual item can be visualized in release R2022a of March 2022. It is based on the inventory KPI charts.
- Menu: Dashboard | Inventory Tab | Checkout Bar Chart
- Click Dashboard (1) to view Dashboard module
- Click "Inventory" Tab for inventory KPIs
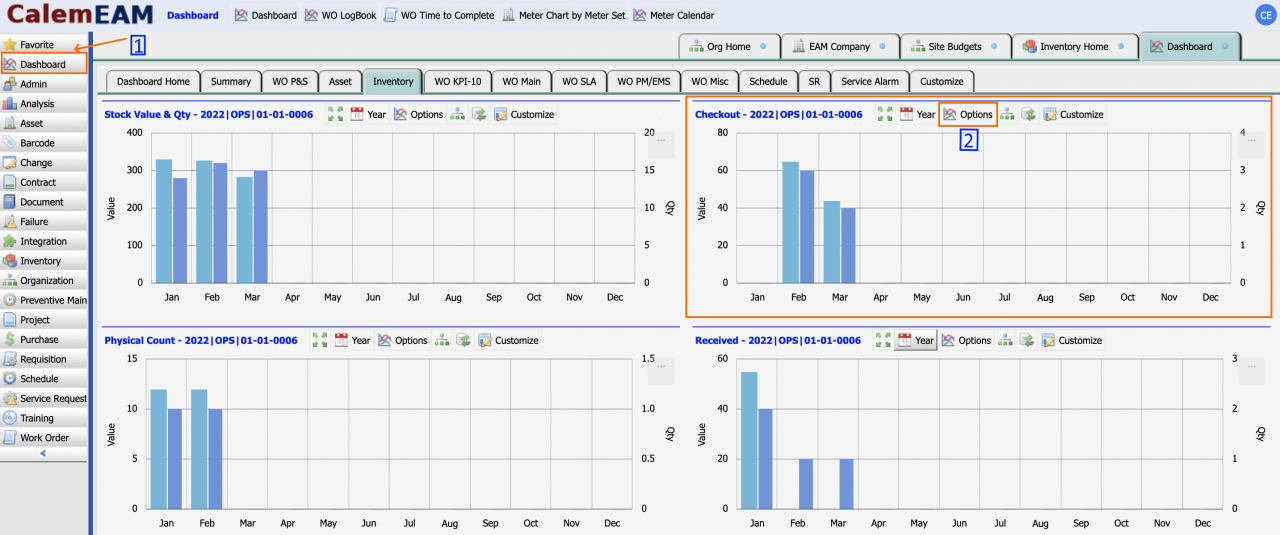
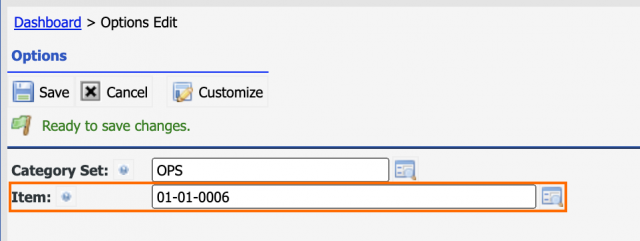
- Click "Options" (2) in the chart above to set an individual item to show in the charts. In the options screen:
- Enter an item to visualize monthly consumption
- Optionally, enter a storeroom category set to exclude storerooms from the KPI calculation. See the Budget Blog for a discussion of storeroom category sets.
- Click "Save" to commit the changes and refresh inventory KPIs.
- The caption of the chart is "2022|OPS|01-01-0006" indicating the KPI is calculated for year "2022", storeroom category set "OPS", and item "01-01-0006".
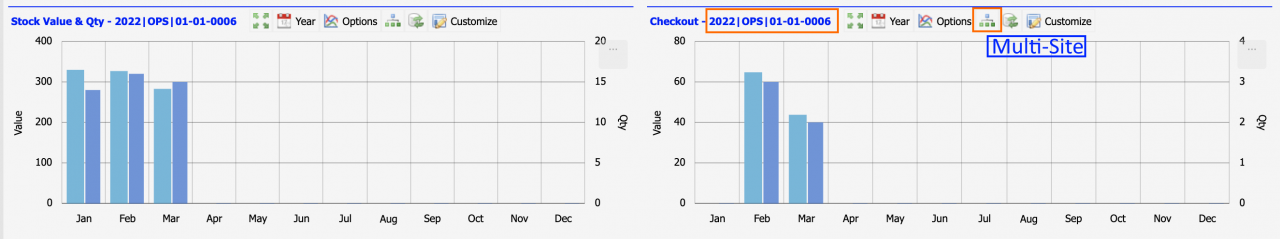
- Click Multi-Site menu icon annotated above to visualize monthly consumption of the item in sites side by side if there are more than one site in your Calem service.
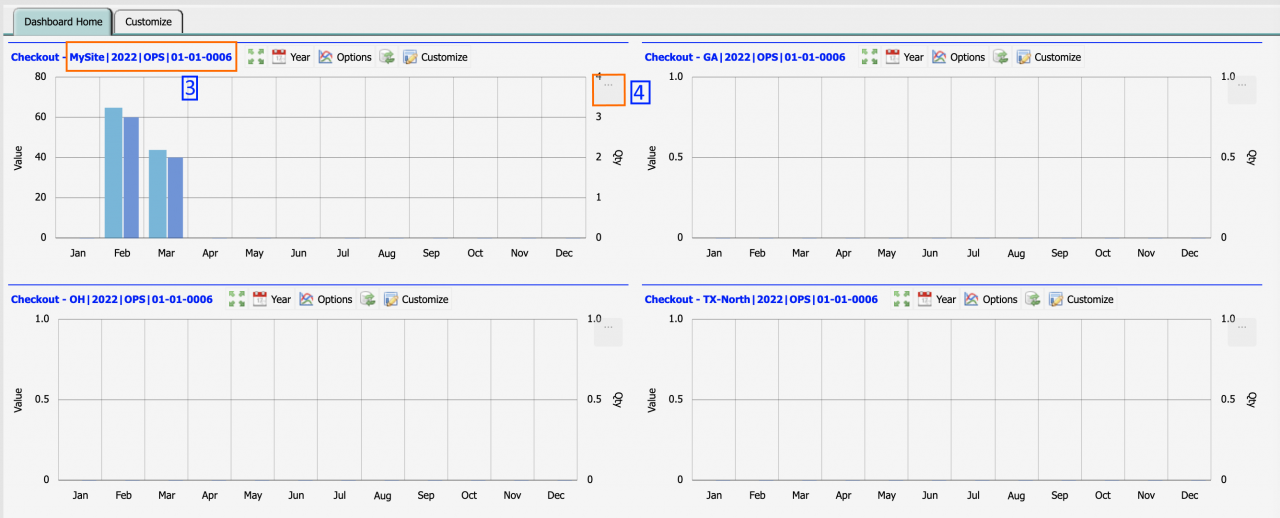
- The caption of a site chart (3) is "MySite|2022|OPS|01-01-0006" which shows the site "MySite", year "2022", category set "OPS" and item "01-01-0006".
- The chart menu "..." (4) can be used to print or export the chart.
Resources
- How to Manage Maintenance Budgets in Calem
- Multi-Site KPIs for Inventory
- How to Transfer and Dispose Inventory
- How to Track Asset Off-Site Repairs
- How to Use Price Lot in Calem
- Work Order Life-Cycle Diagrams
- Asset Tracking in Calem
- User Guide and Admin Guide (customer account required)
- Calem Enterprise Training Site
- Calem Enterprise Blogs
- Calem Enterprise demo