Calem Blogs
Blogs of CalemEAM
KPIs for Auto Min/Max Process
KPIs are available for the Auto Min/Max Process. They help measure the effectiveness of process.
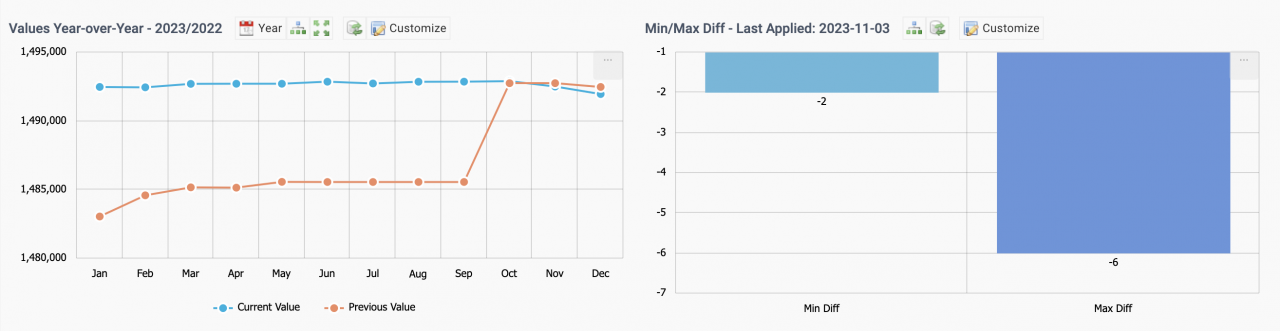
The first KPI is total stock value difference year over year.
- Inventory Value year over year is a KPI to show the inventory valuation of current year and previous year. The goal of the auto min/max process is to set min/max levels based on historical use. The KPI shows the impact of min/max levels to amount of stock to hold.
- The year may be changed to show the value of that year and its previous year.
- Multi-Site is enabled for one to drill down to individual sites.
The second KPI shows the total difference of min/max stock level changes by an auto min/max process run.
- The KPI shows total difference between the new min/max levels and the ones before the process run.
- Multi-Site is enabled for one to drill down to individual sites.
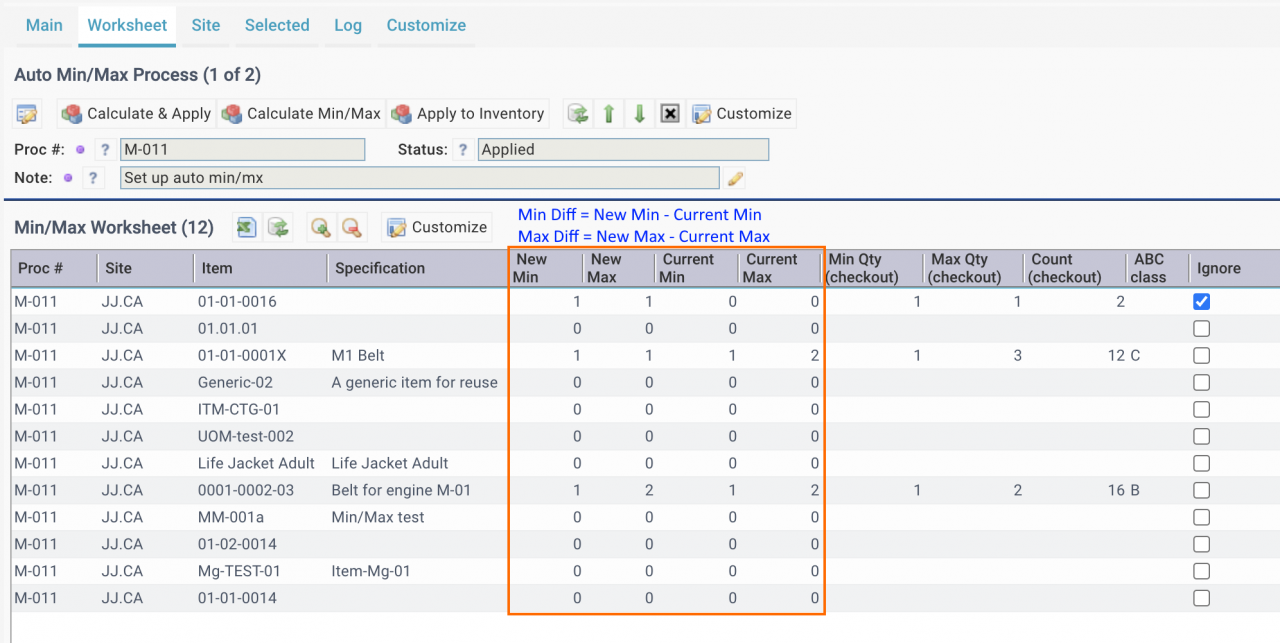
1. Min/Max Diff
The Min/Max Diff in the chart is calculated by the latest Min/Max process row (screenshot below) from the worksheet of a site.
- The sum of "New Min" minus "Current Min" of each row is the "Min Diff".
- The sum of "New Max" minus "Current Max" of each row is the "Max Diff".
Additional Resources
- Auto Min/Max Process
- Barcode for Physical Count
- Barcode for Part Checkout
- Youtube Demo of WO by Asset Scan
- Clock WO by Asset Scan
- Inventory Checkout by Barcode
- Inventory Module Training
- User Guide and Admin Guide (customer account required)
- Calem Enterprise Training Site
- Calem Enterprise Blogs
- Calem Enterprise demo
About the author

Related Posts
By accepting you will be accessing a service provided by a third-party external to https://eam.calemeam.com/