Calem Blogs
Blogs of CalemEAM
Tips for Work Order Pivot Visualization
WO Pivot Visualization is available in the coming release of R21c in July 2021. It provides a visualization of aggregated metrics of work orders.
- The Pivot Visualization is available from work orders lists Open WO, All WO (Performed) and All WO (Time Requested).
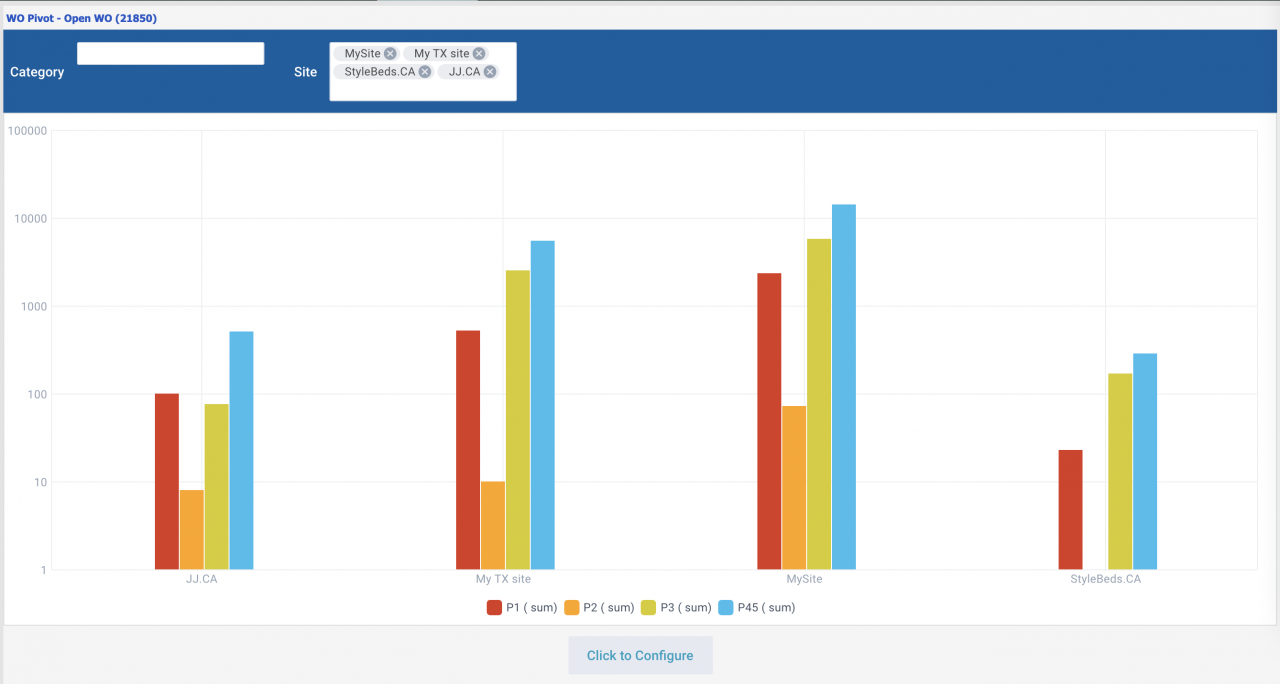
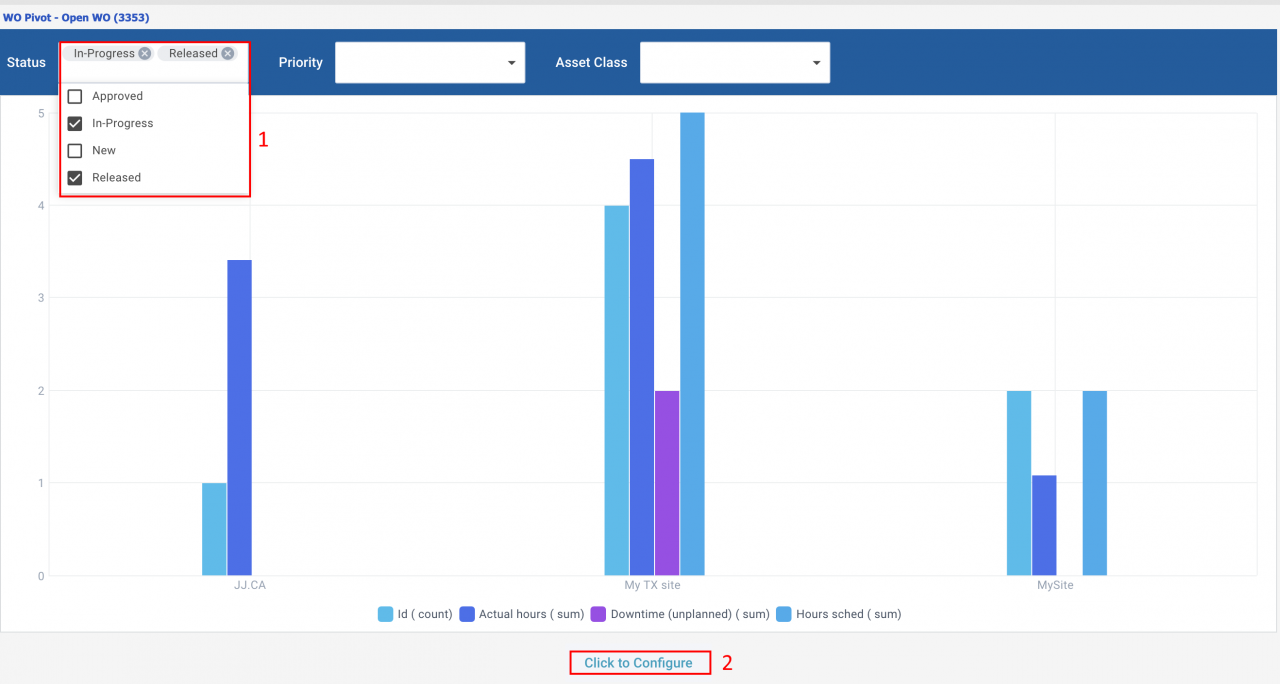
- The Pivot is aggregated by a field with filtering. For instance, the first pivot chart shows the work orders by priorities across selective sites. The 2nd pivot chart shows hours across sites.
- Use "Click to Configure" to modify the visualization including group by, aggregated metrics and filtering (multi-select, or single select).
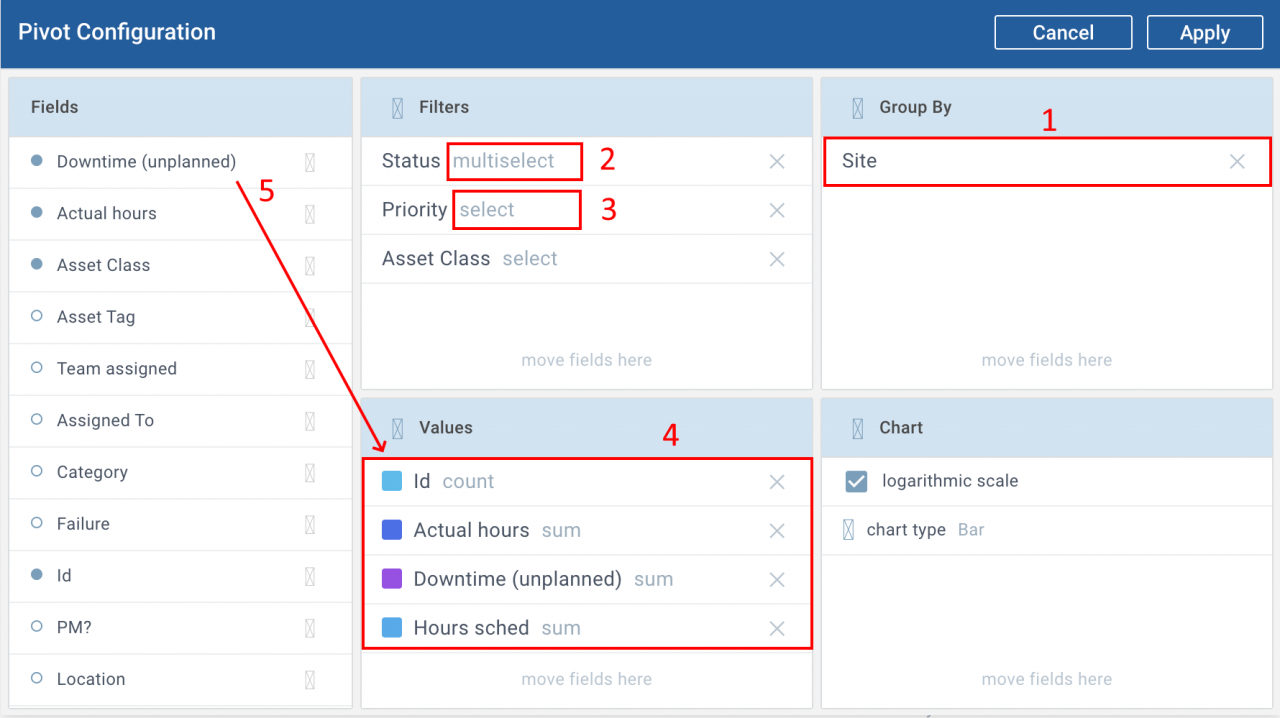
- The configuration screen (from "Click to Configure") morphes data
visualization through grouping, values, and filtering:
- Drag and drop a field (from the list of field in the left) to group by (#1)
- Add filtering with multi, or single select (#2, #3)
- Add values to visualize (#4)
- Modify the chart type (bar or line) and scaling.
1. Pivot from Open WO
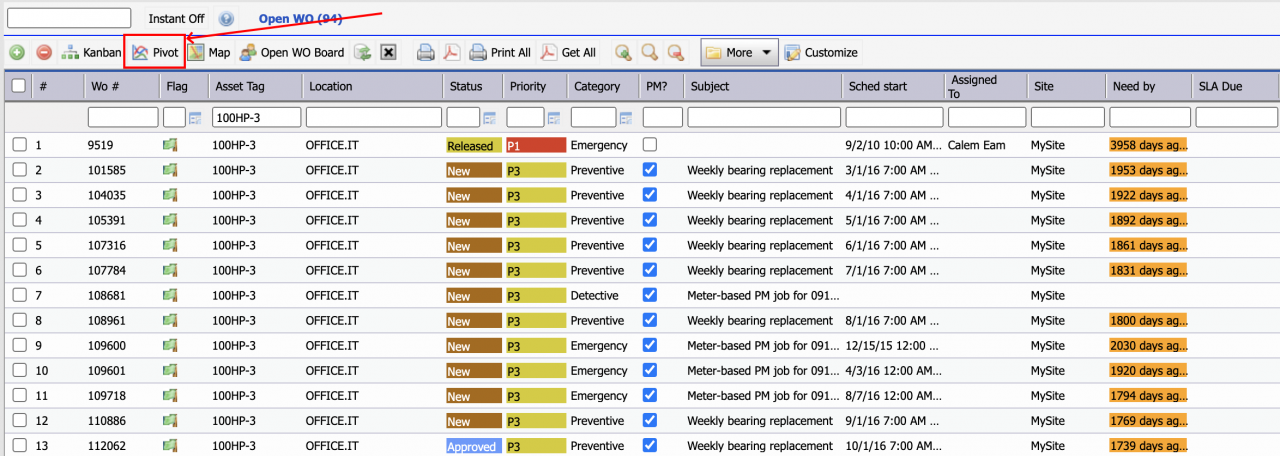
The pivot visualization can be launched from Open WO list (Work Order | Open WO).
- Optionally filter the Open WO to narrow down work orders of interest
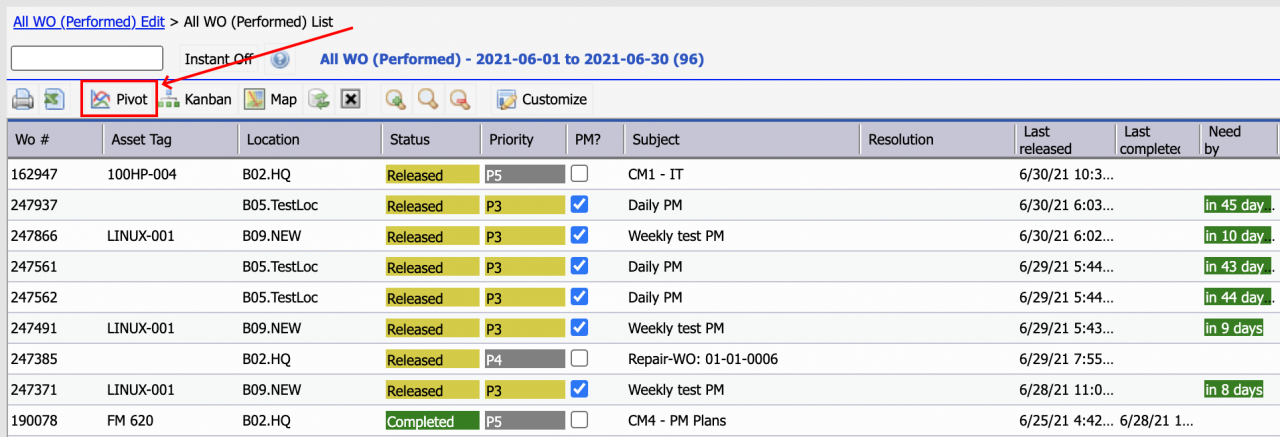
- Click "Pivot" to launch the visualization.
2. Pivot from WO by Time Performed
A new report is available in R21c for all work orders based on performance time.
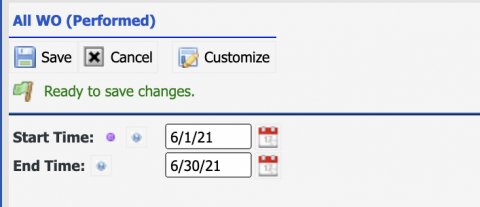
- Work Order | Report | All WO (Performed)
- Work orders are filtered based on performance status time including last released, completed, accepted, rejected, and closed.
- Launch pivot visualization to analyze work orders performed weekly, monthly, or quarterly.
3. Pivot for WO by Time Requested
The pivot visualization can be applied to all work orders based on time requested including corrective maintenance (CM) and preventive maintenance (PM) work orders.
- Work Order | Report | All WO (Time Requested)
- Select a date range to filter work orders based on request time.
- Launch pivot visualization to analyze work orders requested weekly, monthly, or quarterly.
Additional Resources
Related Posts
By accepting you will be accessing a service provided by a third-party external to https://eam.calemeam.com/
