Calem Blogs
An Overview of KPIs/Reports for Maintenance Analysis
There are plenty of KPIs and reports/visualization in Calem to answer questions about maintenance operations. For instance, "What is the work order load this month vs past months?", "What are the top assets that consumed the most resources this month?", "How often are my critical assets failing and how soon the failures are repaired?", etc.
This blog provides a quick overview of selective KPIs and reports/visualization. Additional blogs are referenced at the bottom of the blog. You can find more information about KPIs and reports/visualization in Calem.
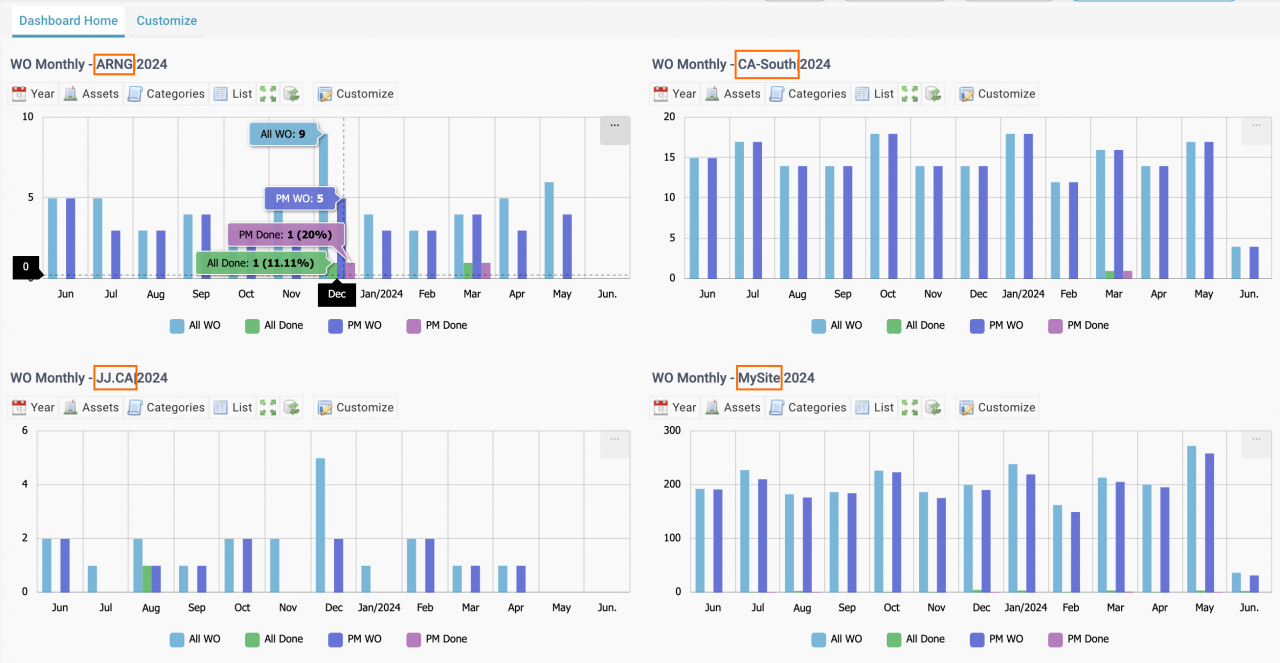
1. Work Order Monthly KPI
The monthly KPI shows the historical work load and completion rate by month (screenshot below). Sites can be displayed with this KPI side by side for comparison. For instance, ARNG, CA-South, JJ.CA and MySite are four plants (or sites) shown side by side in the next screenshot.
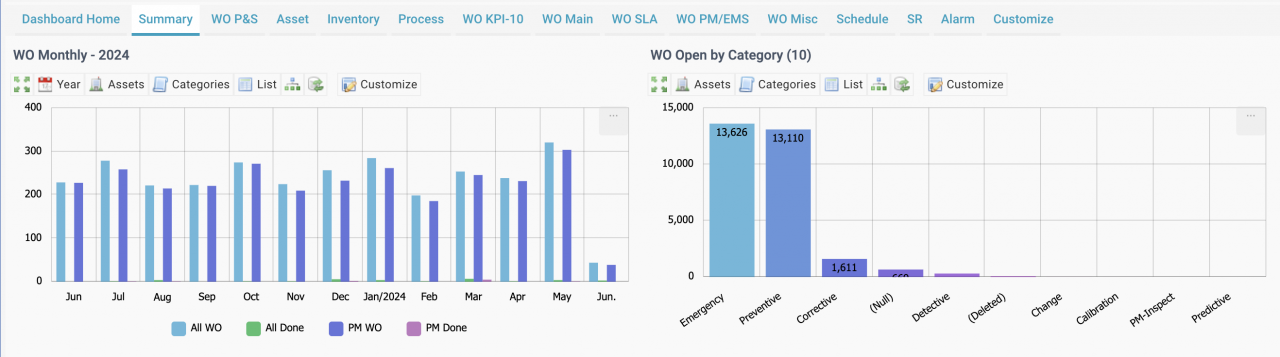
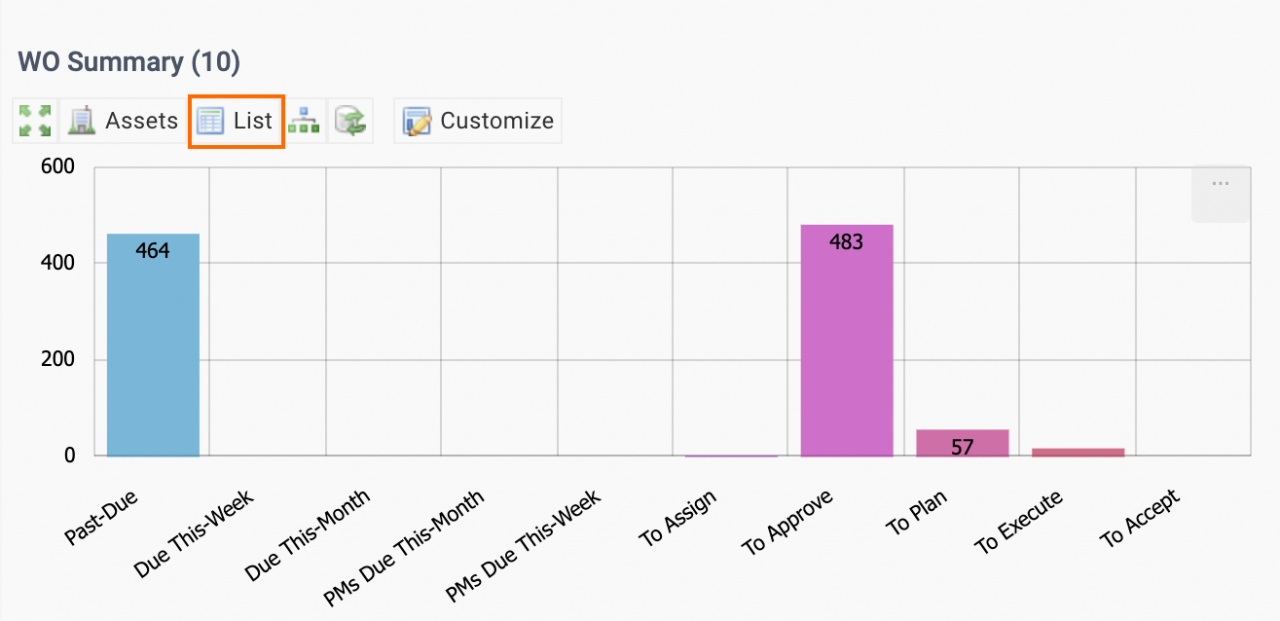
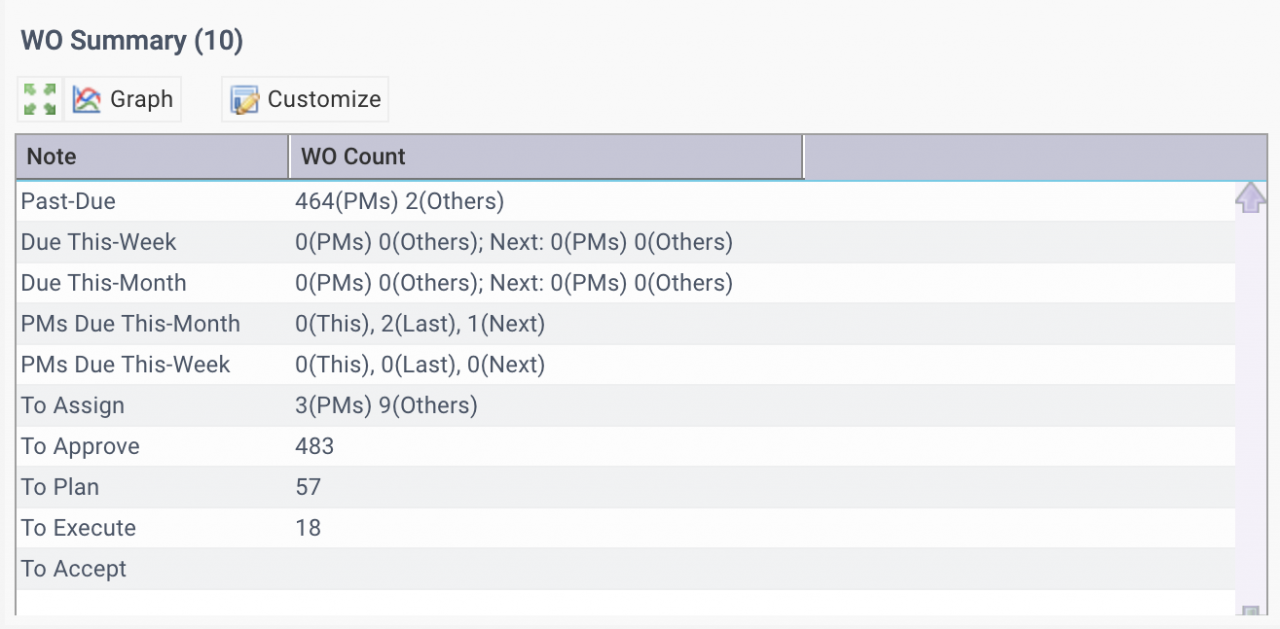
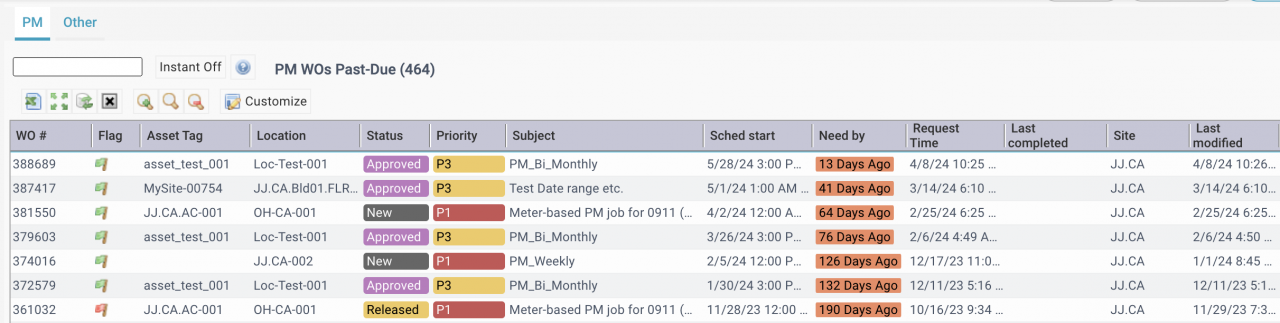
2. WO Summary KPI
This KPI shows the current work orders in bar charts based on statuses and categories. The "List" menu shows the load of preventive work orders (PMs) for this month, previous month and next month. Drill-down of the list shows individual work orders by categories (PM or other).
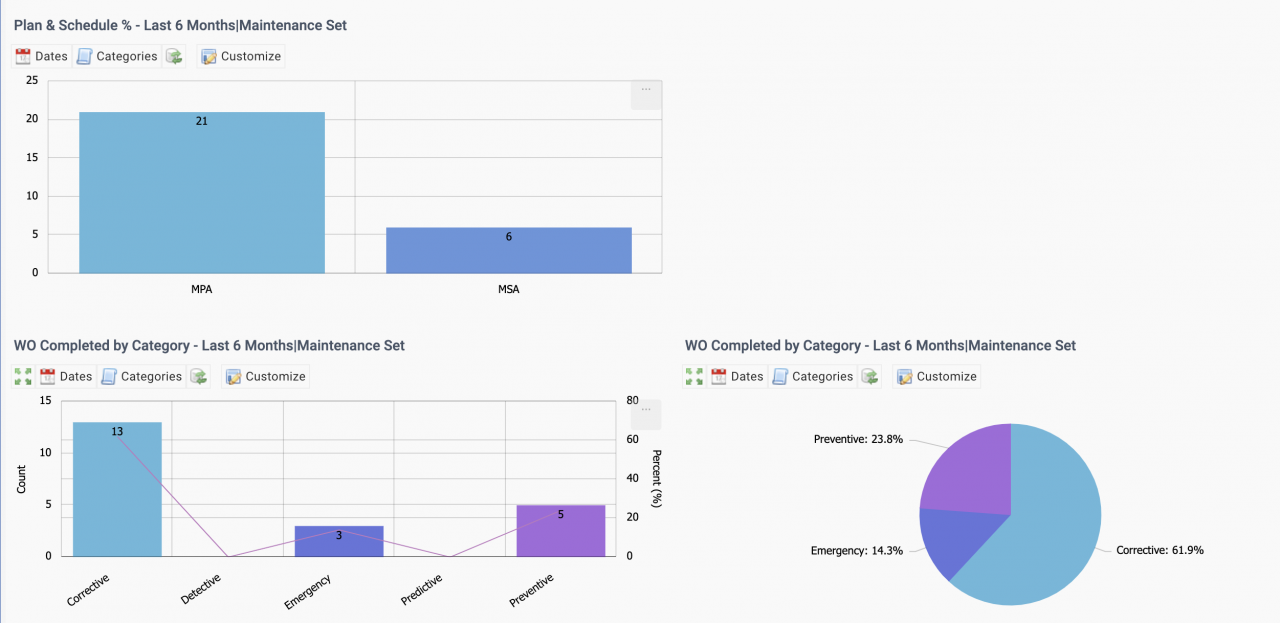
3. Work Order Planning and Scheduling KPI
The planning KPI (MPA) shows the efficiency of approving and releasing work orders as they come in. The scheduling KPI (MSA) shows the efficiency of completing work orders approved and released. Work orders completed are charted by categories (below).
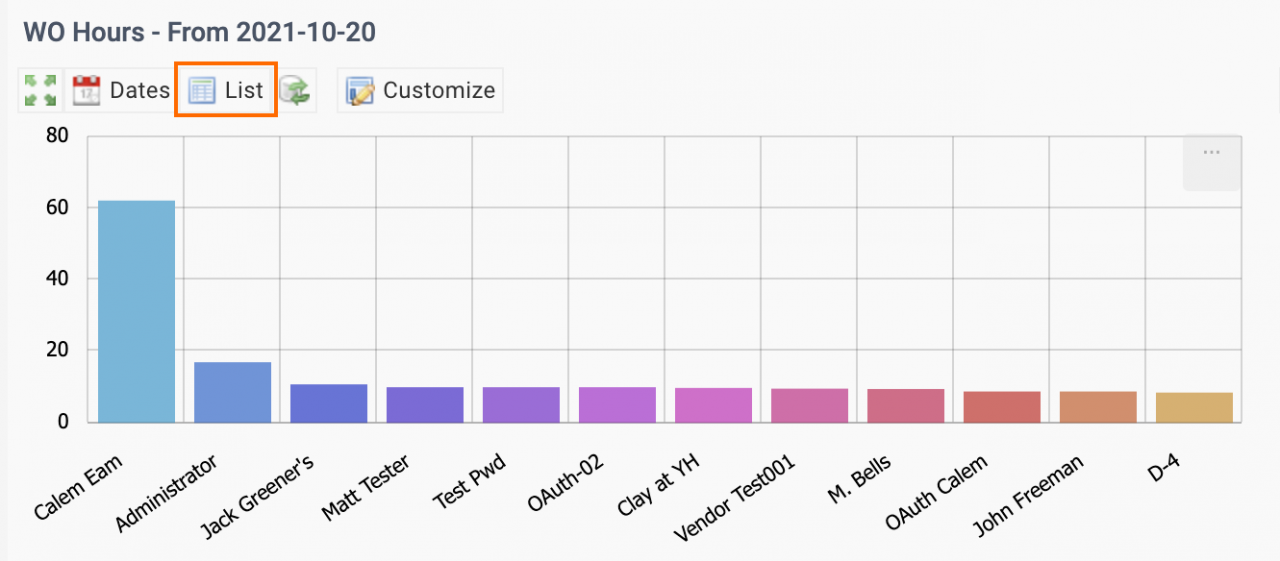
4. Top Resources
The KPI shows top resource hours reported in work orders. It allows supervisors to rank resources by hours in work orders. Use "List" menu to drill down to work orders where hours are spent.
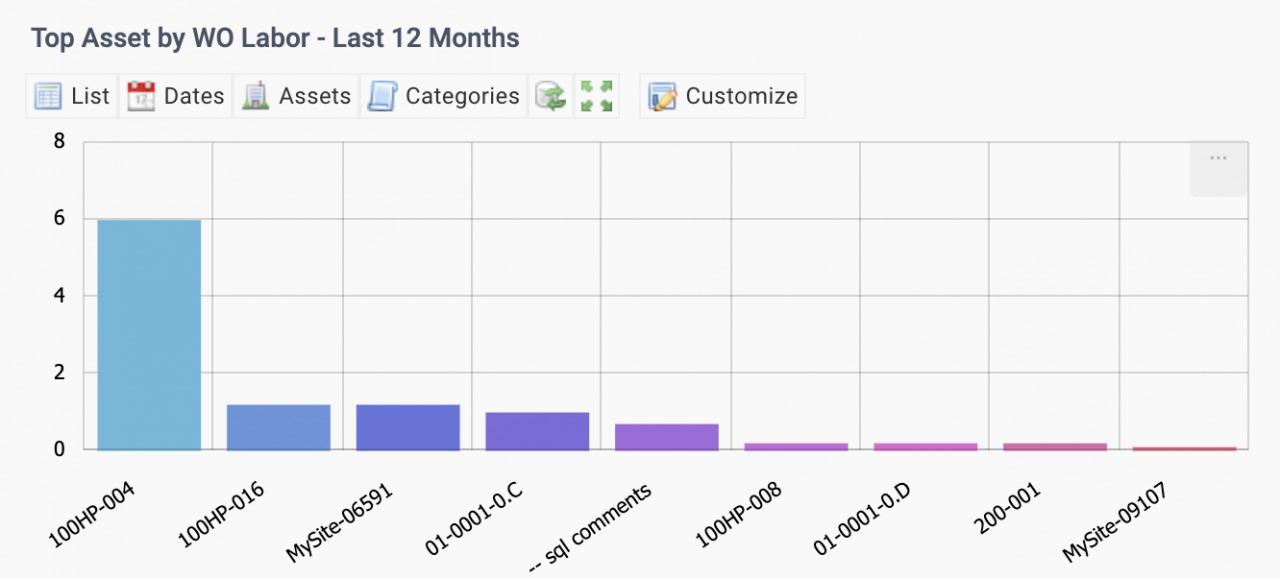
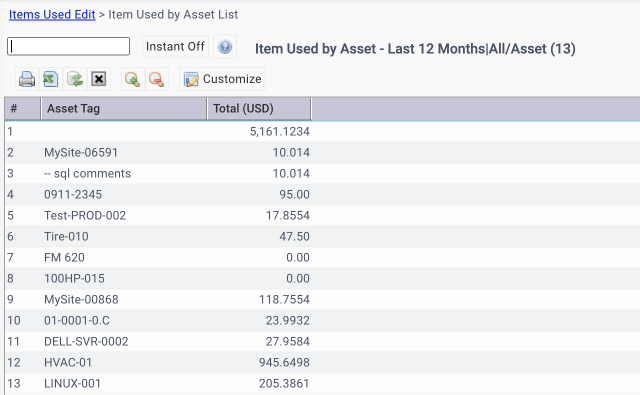
5. Top Assets of Resources Spent
This KPI shows the assets that most of resources hours are spent. Use "List" menu to drill down to work orders for those assets.
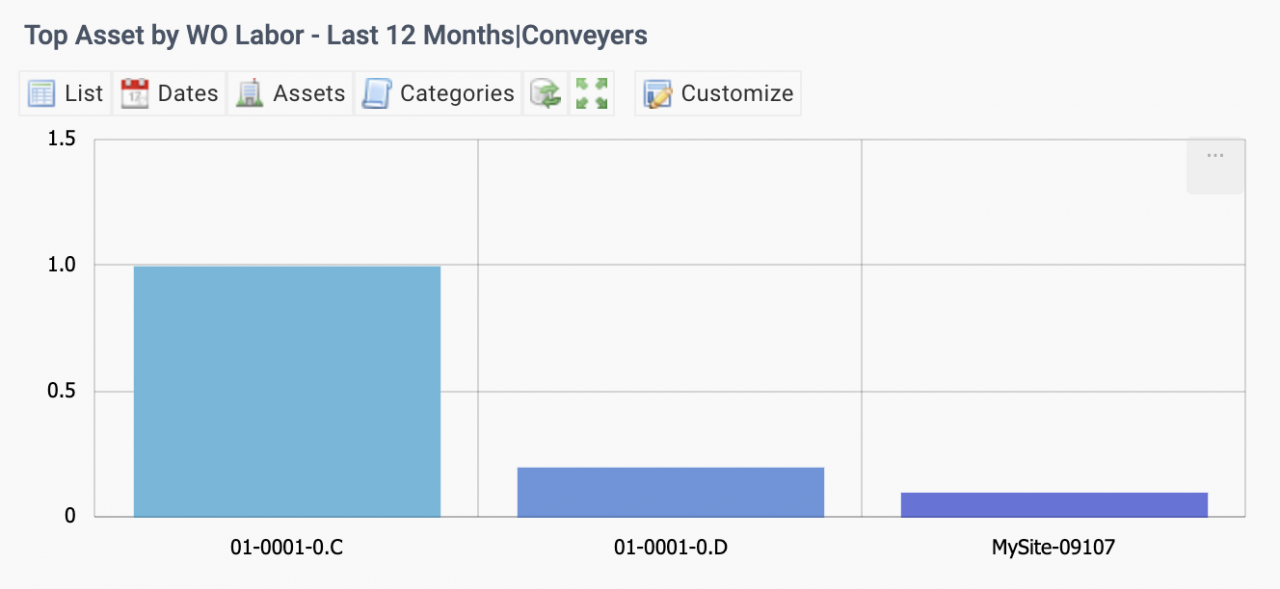
6. Top Resources Spent for Critical Assets
The top assets by resource KPI can also be generated for critical assets configured by supervisors by assets or locations. For instance, a set of assets at the location "Conveyers" is used to generate the KPI.
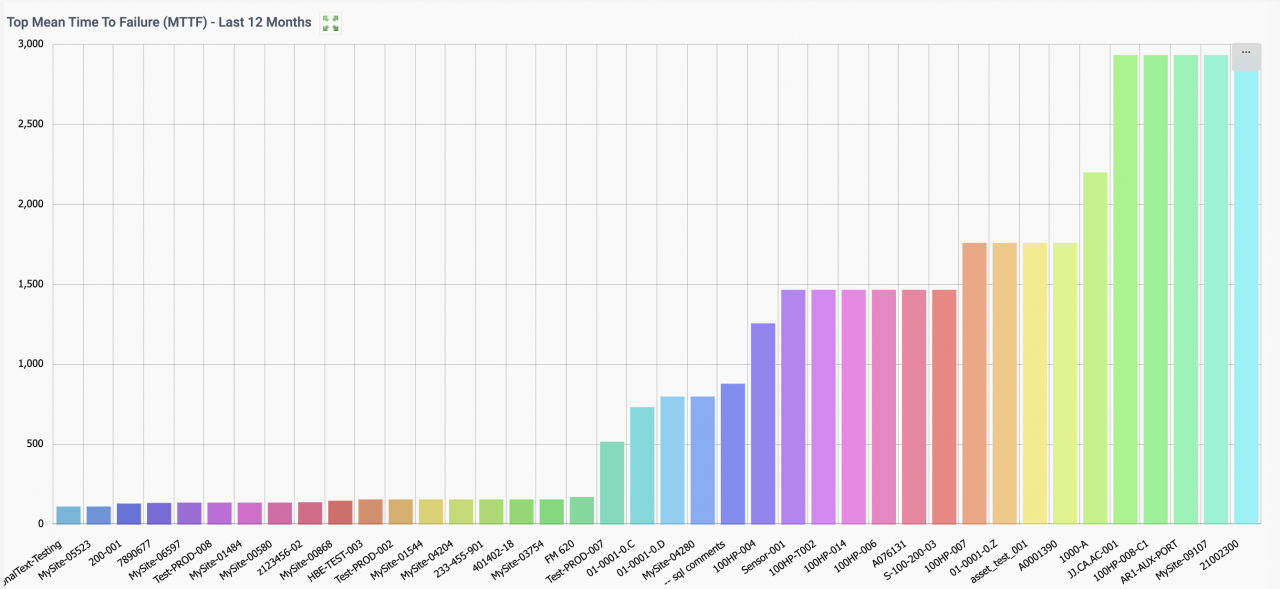
7. Top Assets by Mean Time To Failure (MTTF)
This KPI shows the top assets prone to fail based on Mean Time To Failure (MTTF). Use "List" menu to drill down to breakdown work orders for the KPI.
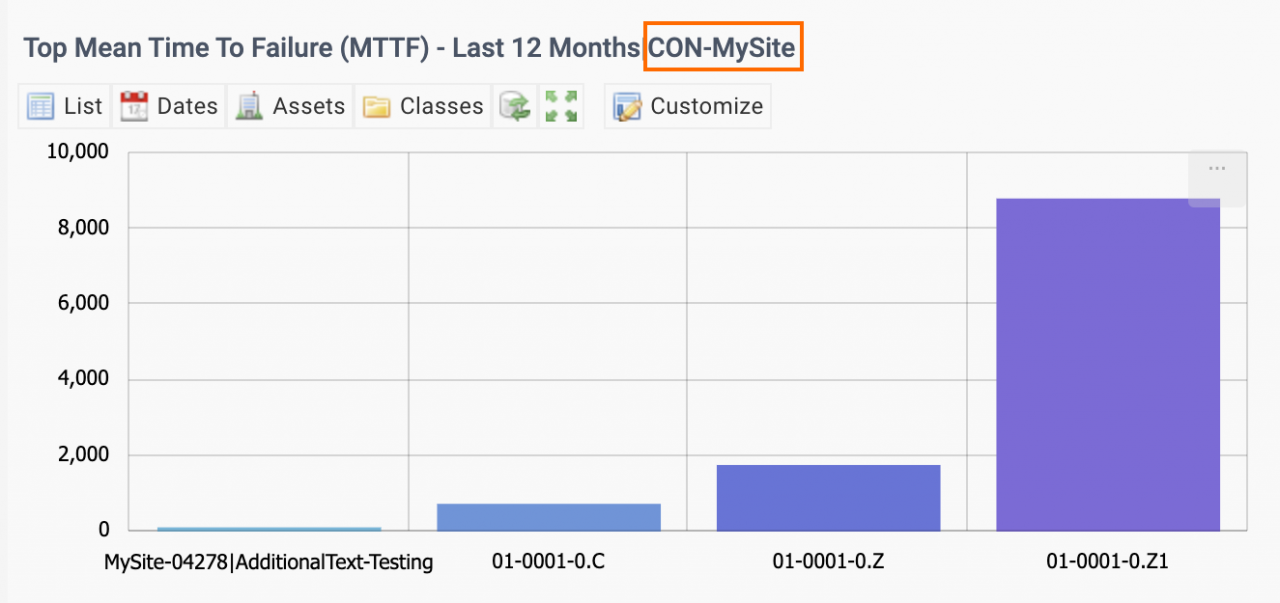
8. Top Assets by Mean Time To Failure (MTTF) for Critical Assets
The KPI can also be generated for critical assets configured by supervisors by assets or locations. For instance, a set of assets "CON-MySite" is used to generate the KPI.
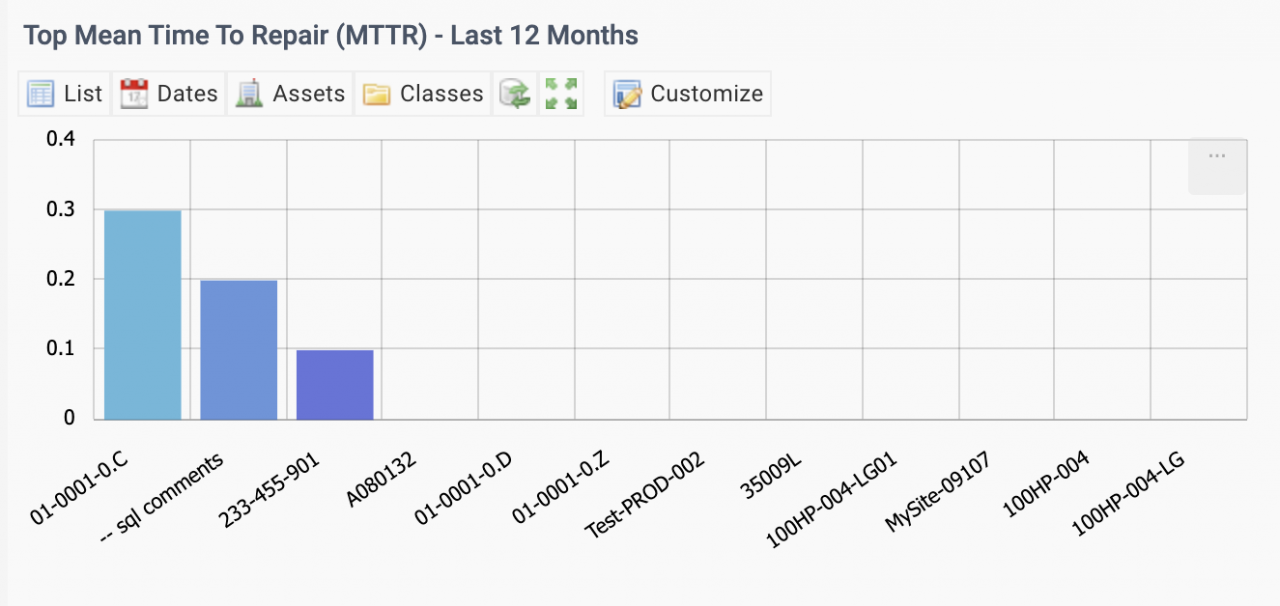
9. Top Assets by Mean Time To Repair (MTTR)
This KPI shows the top assets based on Mean Time To Repair (MTTR). Use "List" menu to drill down to breakdown work orders for the KPI.
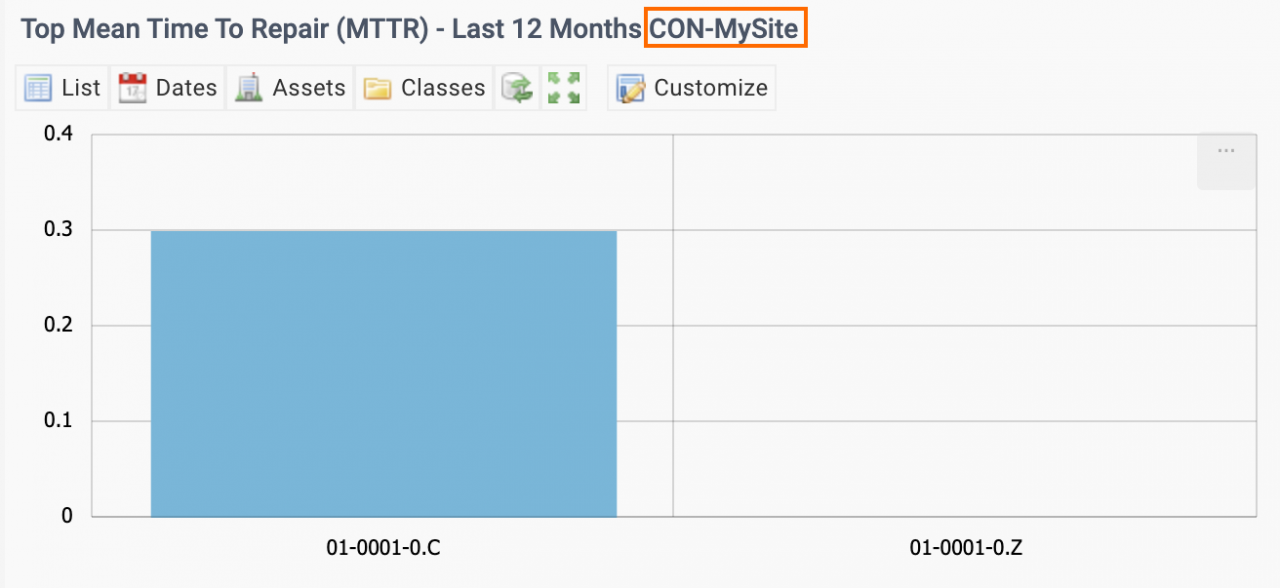
10. Top Assets by Mean Time To Repair (MTTR) for Critical Assets
The KPI can also be generated for critical assets configured by supervisors by assets or locations. For instance, a set of assets "CON-MySite" is used to generate the KPI.
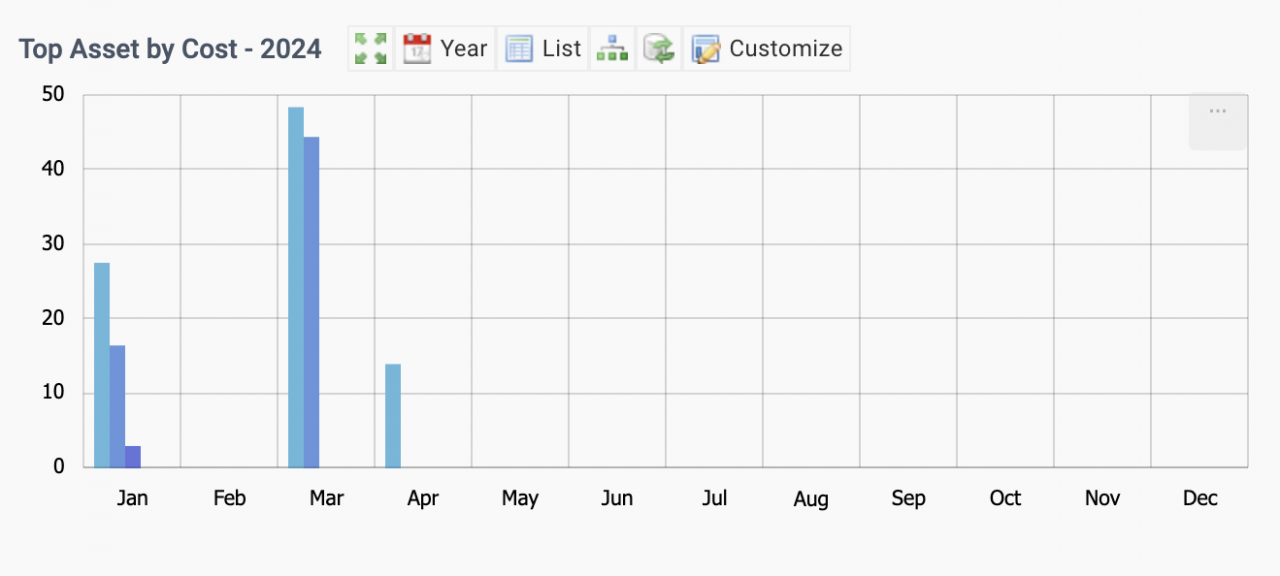
11. Top Assets by Material and Services Spent
This KPI shows the top assets based on material and services spent by month. Use "List" menu to drill down to work orders with material/service usage for the KPI.
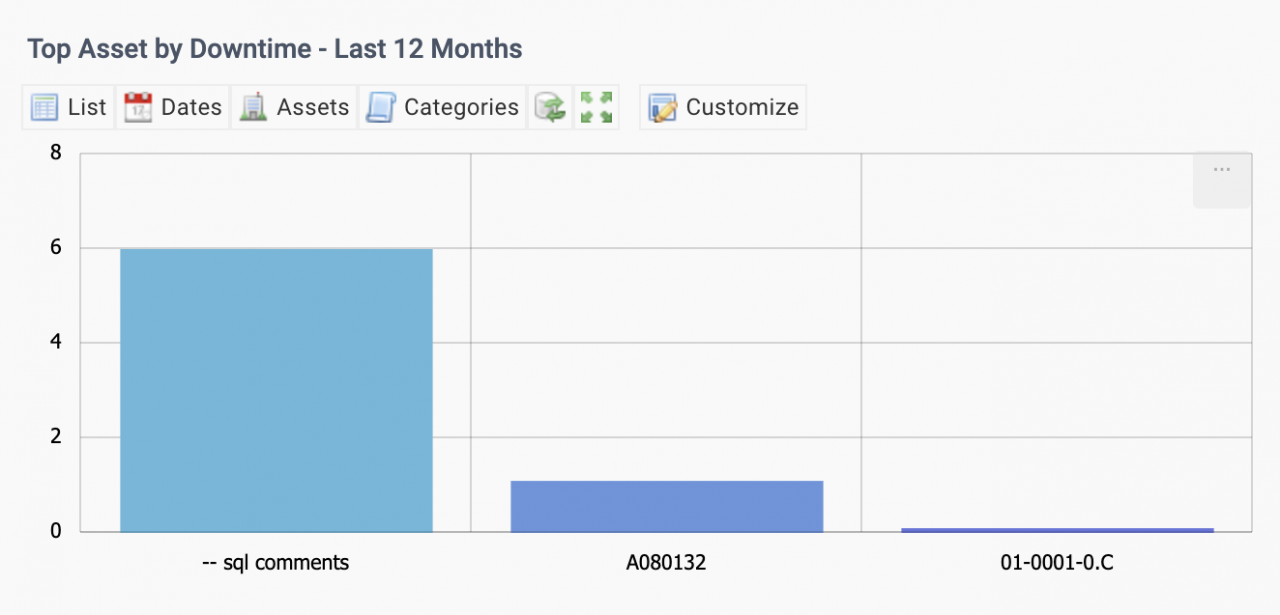
12. Top Assets by Downtime Hours
This KPI shows the top assets based on downtime hours. Use "List" menu to drill down to work orders with downtime for the KPI.
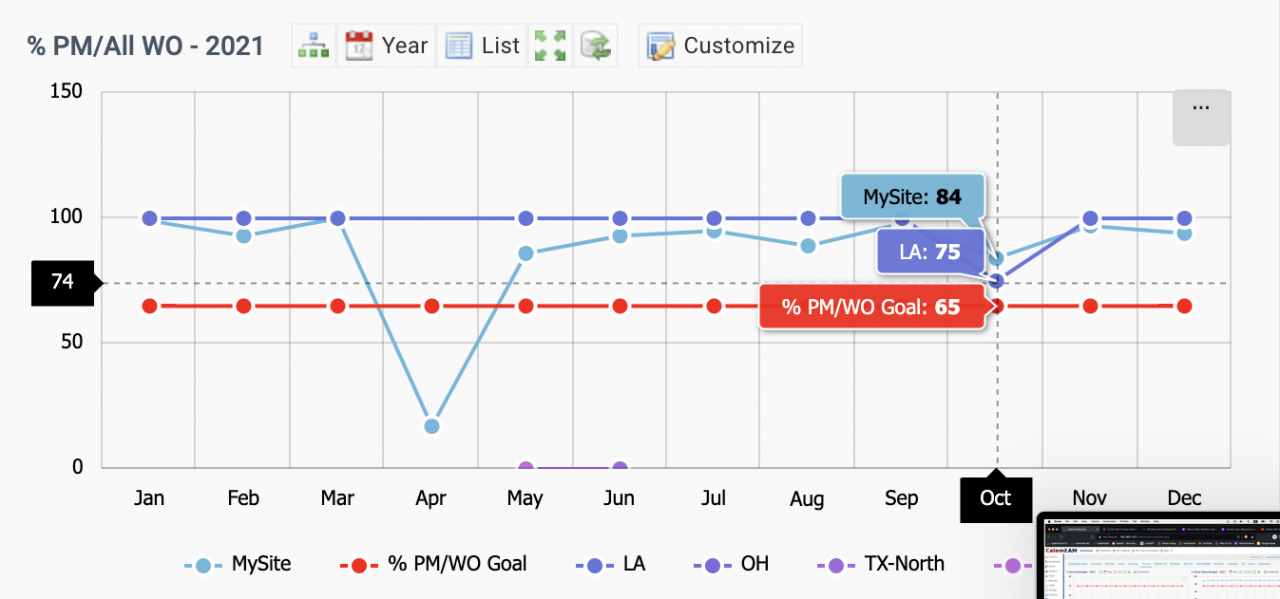
13. Process KPIs for Plants
Process KPIs are measurements scaled to all the plants. For instance, a goal of PM to all work order ration is 65% for an organization, the measures can be calculated for all the plants and charted against the goal (below). Other process KPIs include Actual spent vs budgets, % of PMs vs other work orders, outside services spent vs bugets, etc.
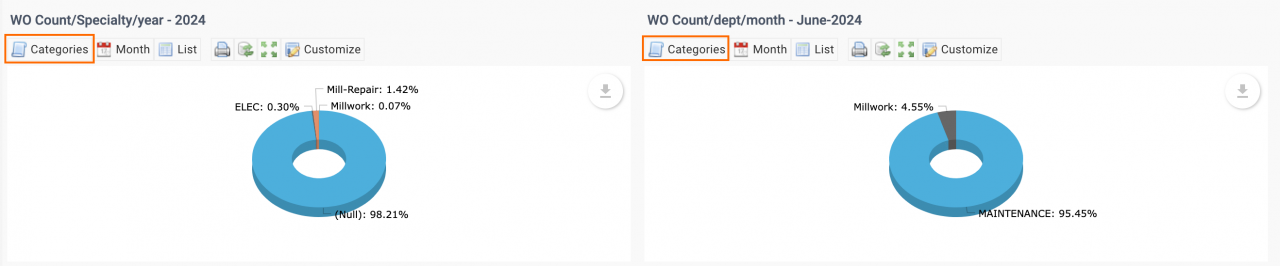
14. Work Orders by Specialty/Dept in Month/Year
The KPIs show the number of work orders by specialty or department for a month or a year. The charts can be further sliced by work order categories.
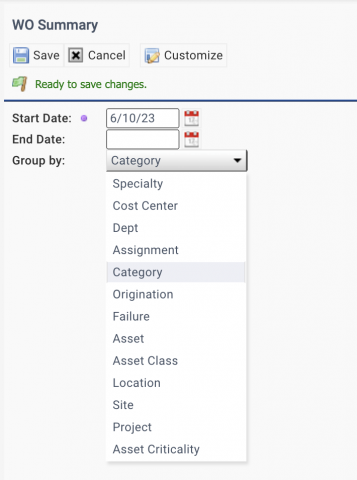
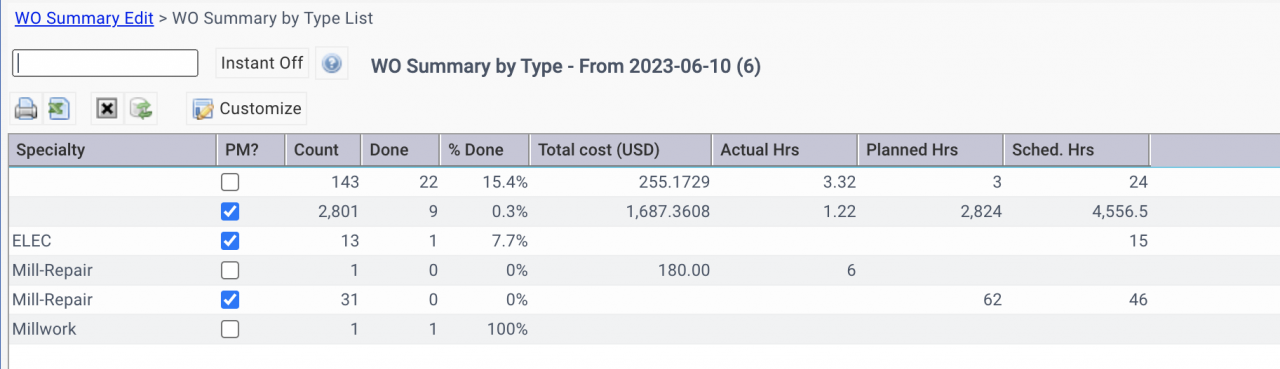
15. Work Order Summary Reports
Work orders can be summarized by various attributes such as specialty, asset, and failure codes. The summary list can be further drilled down to work orders.
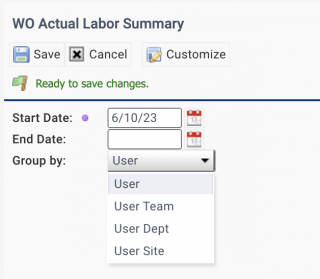
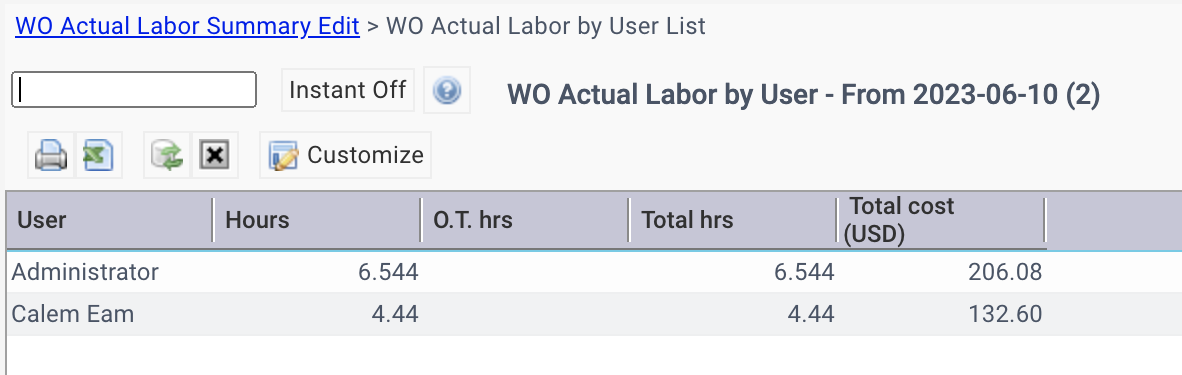
16. Work Order Labor Summary
Work order labor hours can be summarized by user, team, site and department. The summary list can be further drilled down to work orders.
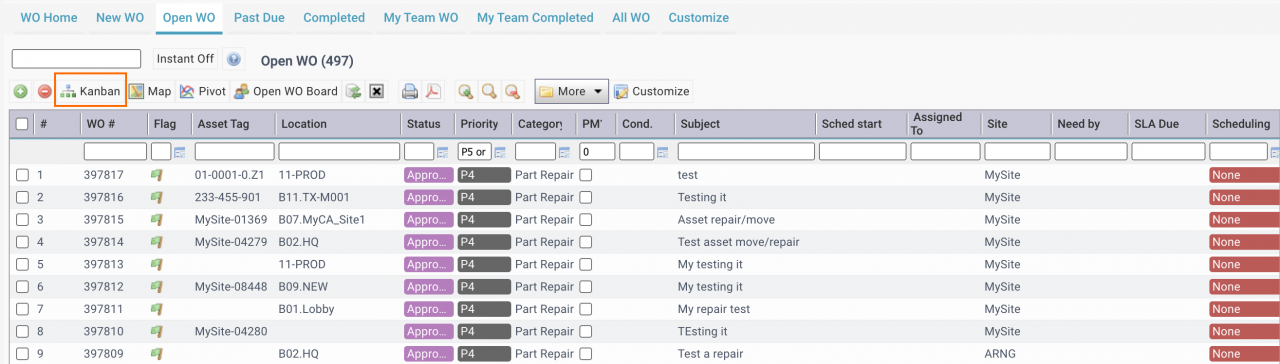
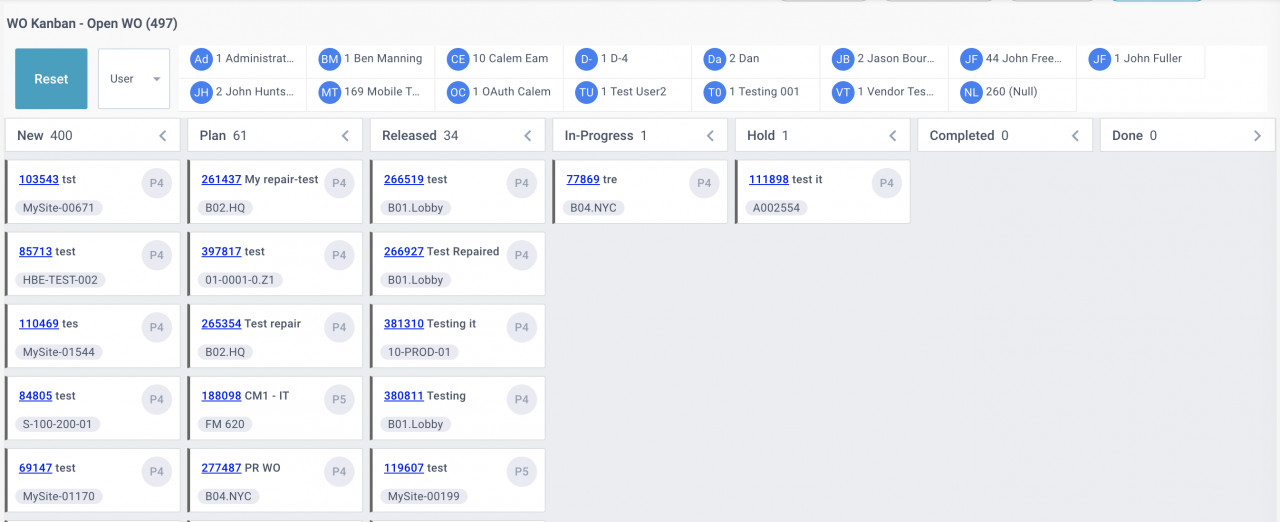
17. Work Order Kanban
Work orders can be visualized in a Kanban board for progress analysis. For instance, the Open WO list is filtered based on priority and excludes PM work orders. The filtered list is visualized in Kanban. Work orders are shown by statuses. Work load can be viewed by users or teams. Drag-and-drop can be used to transition work orders to next statuses of the lifecycle processes.
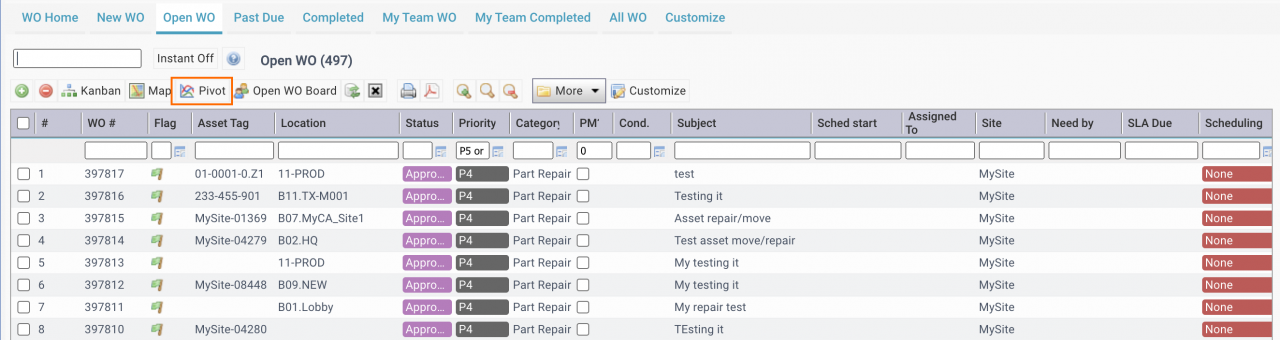
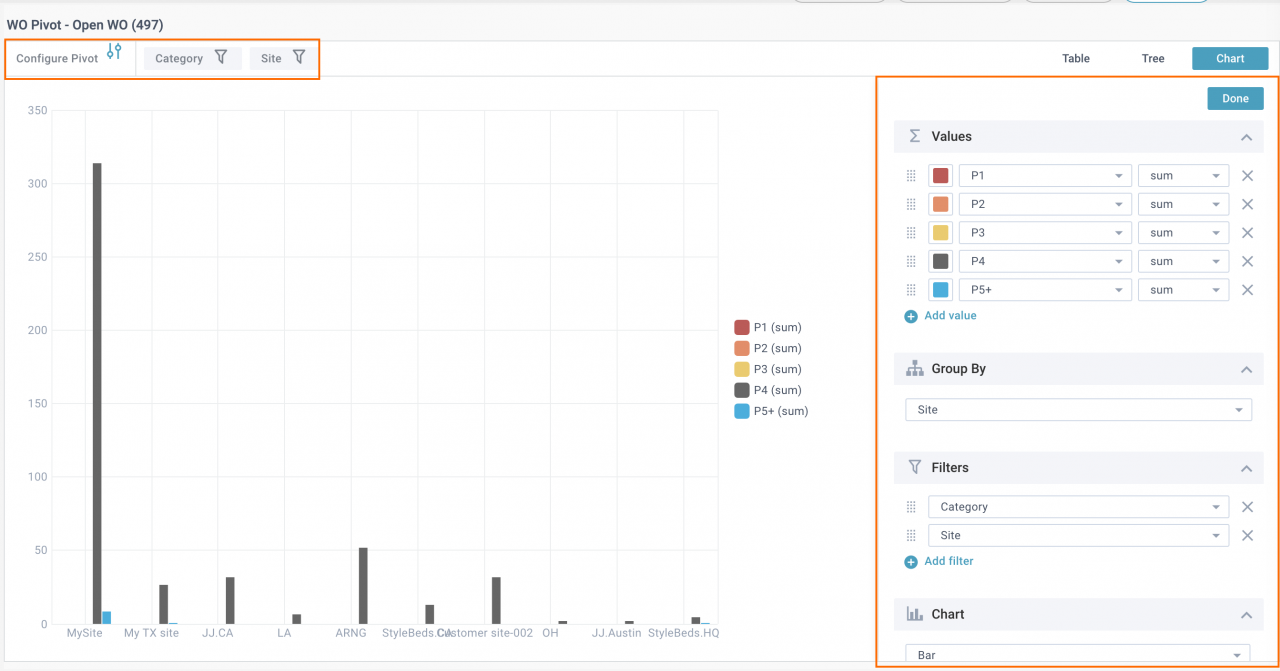
18. Work Order Pivot
Work orders can be visualized by pivoting. For instance, the Open WO list is filtered based on priority and excludes PM work orders. The filtered list is visualized in a pivot view which allows different summary values, groups and chart types.
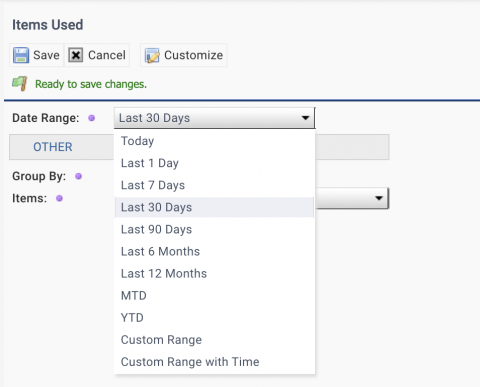
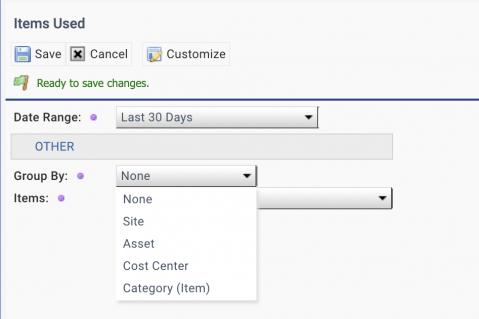
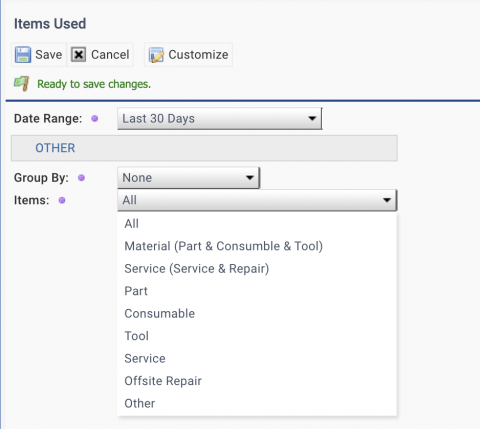
19. Material and Service Usage
Items used can be reported by a date range, a subject, and based on material and services. It helps answer questions about where and how material/services are used. A summary line can be drilled down to checkout transactions.
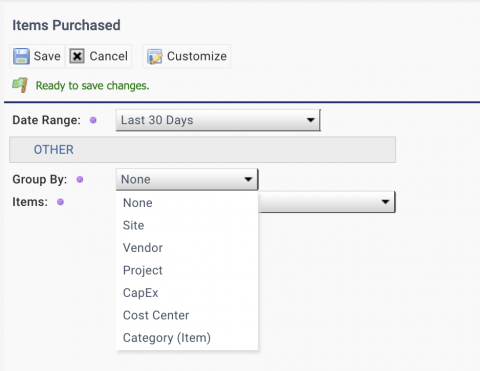
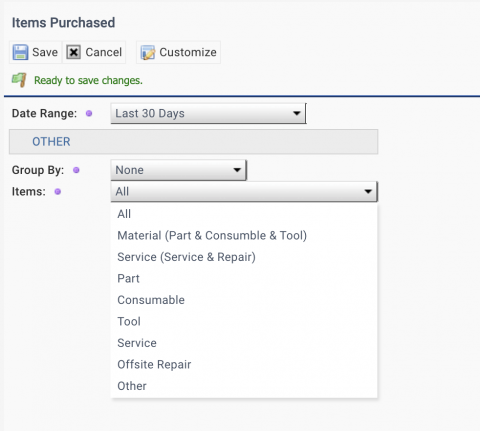
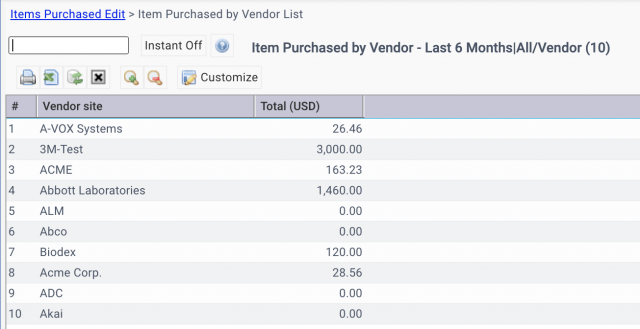
20. Material and Services Purchased
Items purchased can be reported by a date range, a subject, and based on material and services. It helps answer questions about what items and services have been purchased, and from whom. A summary line can be drilled down to purchase lines.
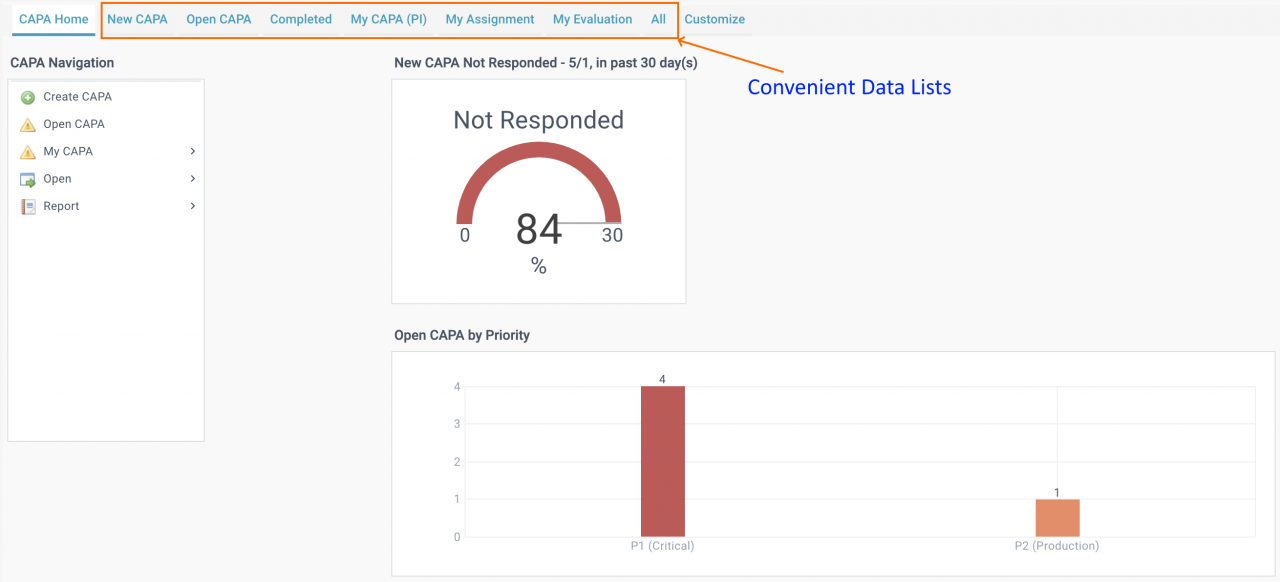
21. CAPA
CAPA is a quality management process mandated by US Food and Drug Administration (FDA) for medical device manufacturers. It has a general appeal for an organization to get better by addressing root causes of problems, and eliminating or reducing the recurrences of problems addressed previously. CAPA Home page shows the current state of CAPAs to be processed. It also includes convenience data lists for efficient daily administration.
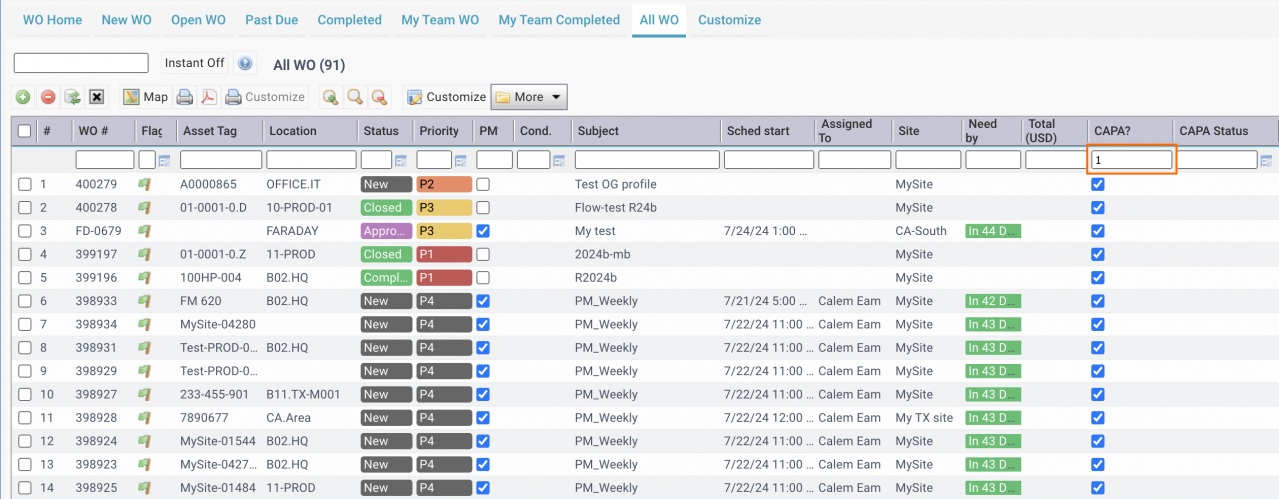
22. Work Orders and CAPA
Work orders are integrated with CAPA processes. Breakdown work orders will be auto-flagged for CAPA review so that CAPA processes can be activated and reviewed by QA and CAPA board. For instance, all work orders may be queried with "CAPA?" flag to view CAPA work orders and their CAPA statuses. A new CAPA case may be triggered by the review of a CAPA work order.
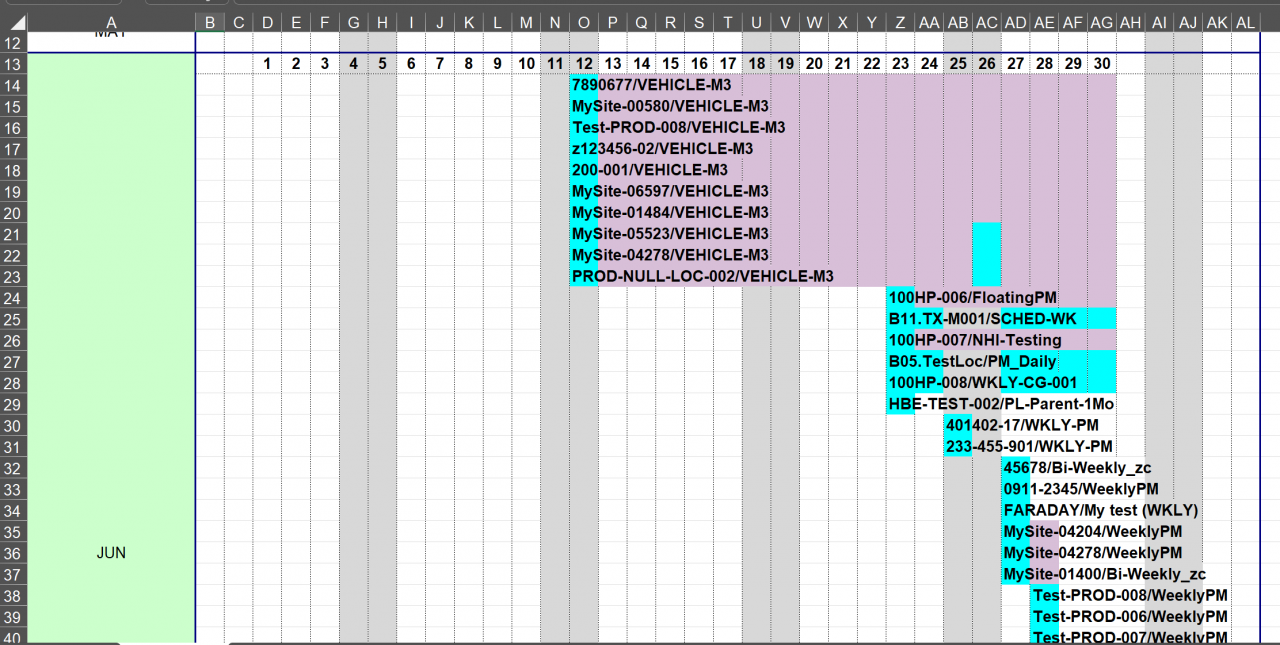
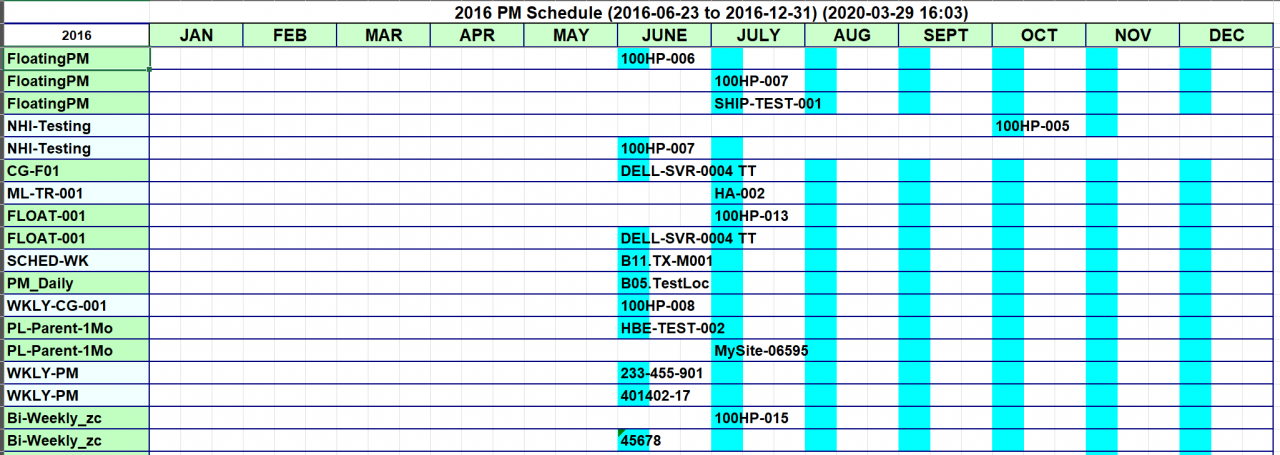
23. PM Calendar Report
Future PMs can be projected and generated into a calendar view in Excel. For instance, the PMs for June is shows in the date calendar (screenshot below). They are also shown in monthly view (next screenshot).
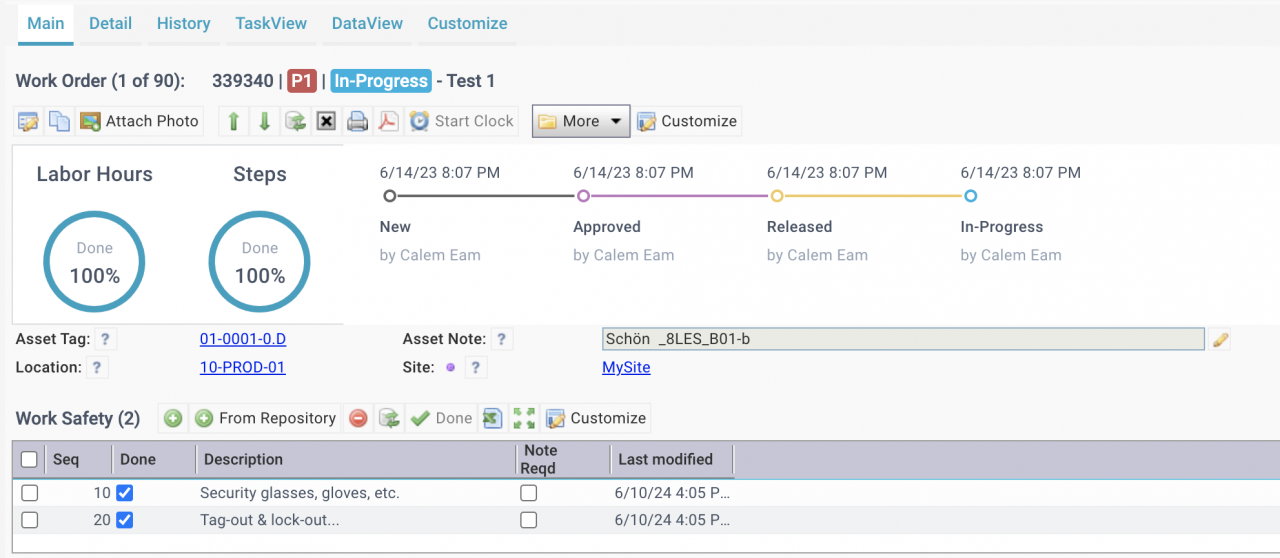
24. Work Order Timeline
Work Order Timeline shows the lifecycles of a work order with summary of hours and steps completed. Technicians and supervisors can use this view to quickly identify what is left to do for a work order.
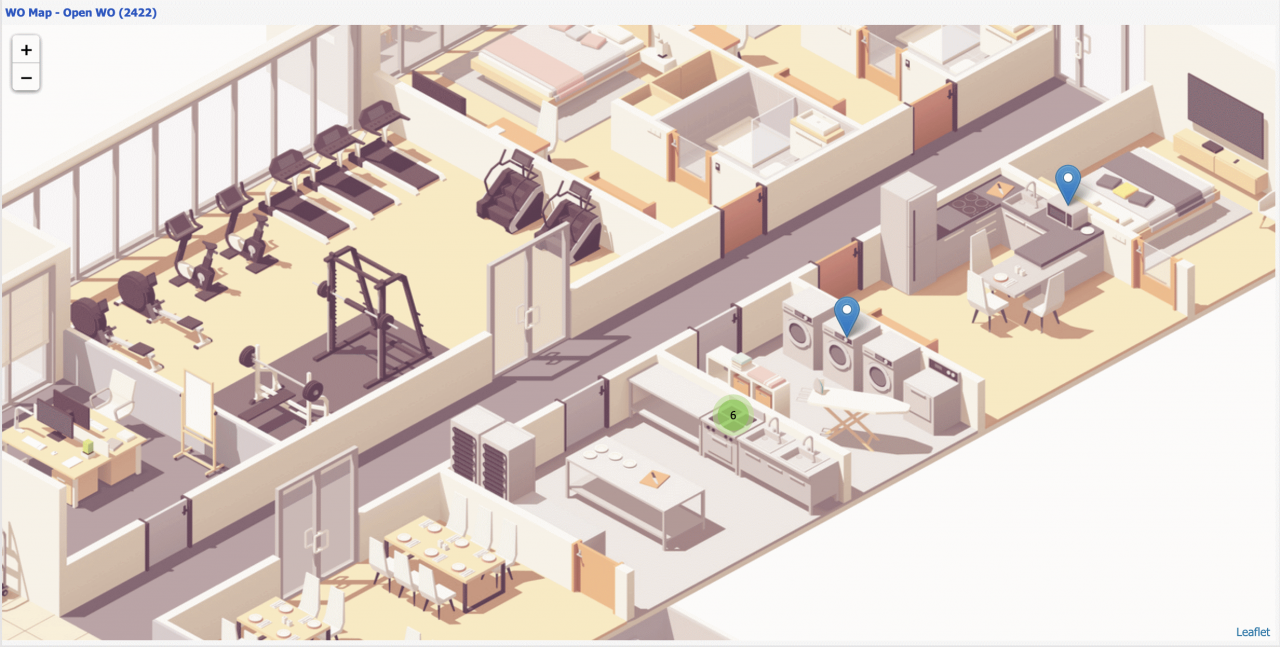
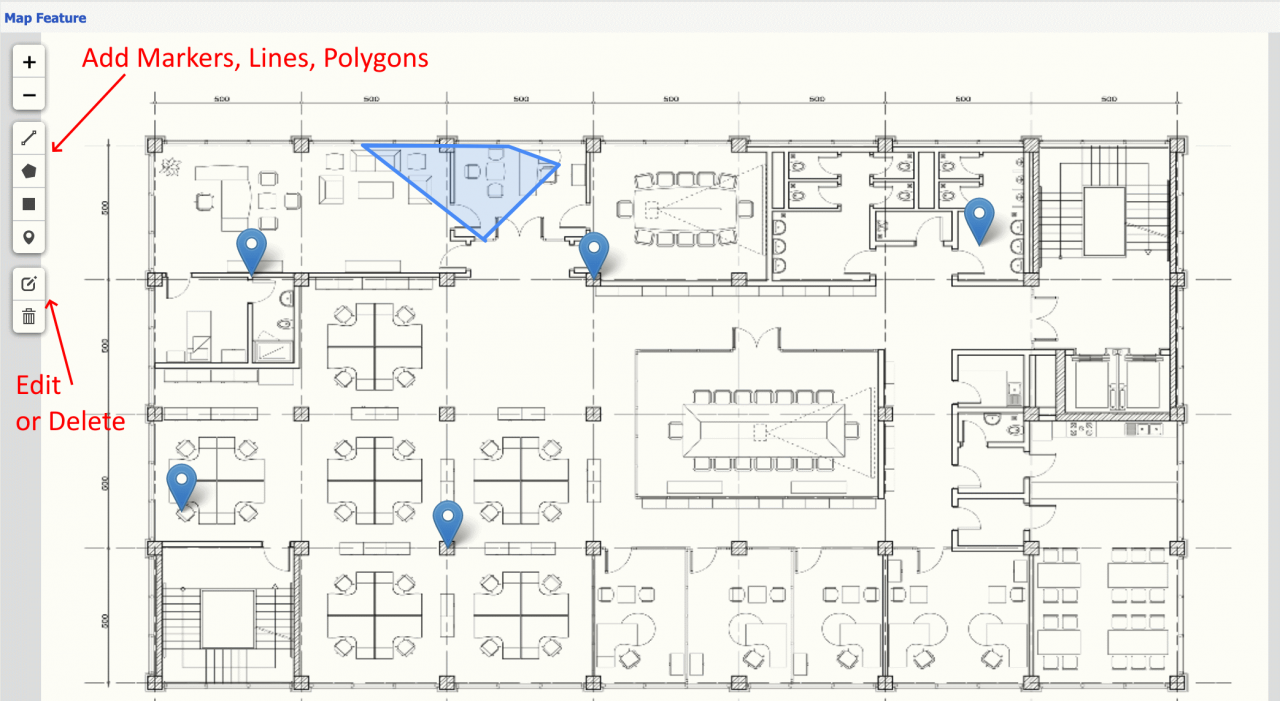
25. Visualize Work Orders in Floorplans
Floorplans, including drawing or pictures, can be digitized in Calem for assets and locations. Work orders can then be visualized in floorplans for better clarity of where work orders are to be performd.
Some of the additional KPIs, reports and visualization are listed in the "Additional Resources" section below. Blogs and User Manuals may be referenced for more information about them.
Additional Resources
- How to Use the Calendar View for Work Orders
- How to Set Up Map Views in Calem
- How to Visualize Work Orders by Open WO Chart
- Work Order Logbook
- How to Manage Asset Relationship in Calem
- Dashboard Module Training
- PM Module Training
- Work Order Module Training
- How to Manage Resource Schedules
- How to Do Weekly Schedules by Teams
- User Guide and Admin Guide (customer account required)
- Calem Enterprise Training Site
- Calem Enterprise Blogs
- Calem Enterprise demo
About the author

Related Posts
By accepting you will be accessing a service provided by a third-party external to https://eam.calemeam.com/